151
Buy Canadian Victory: January saw the biggest drop in border crossings since the pandemic
(sh.itjust.works)
A community dedicated to buying Canadian products.
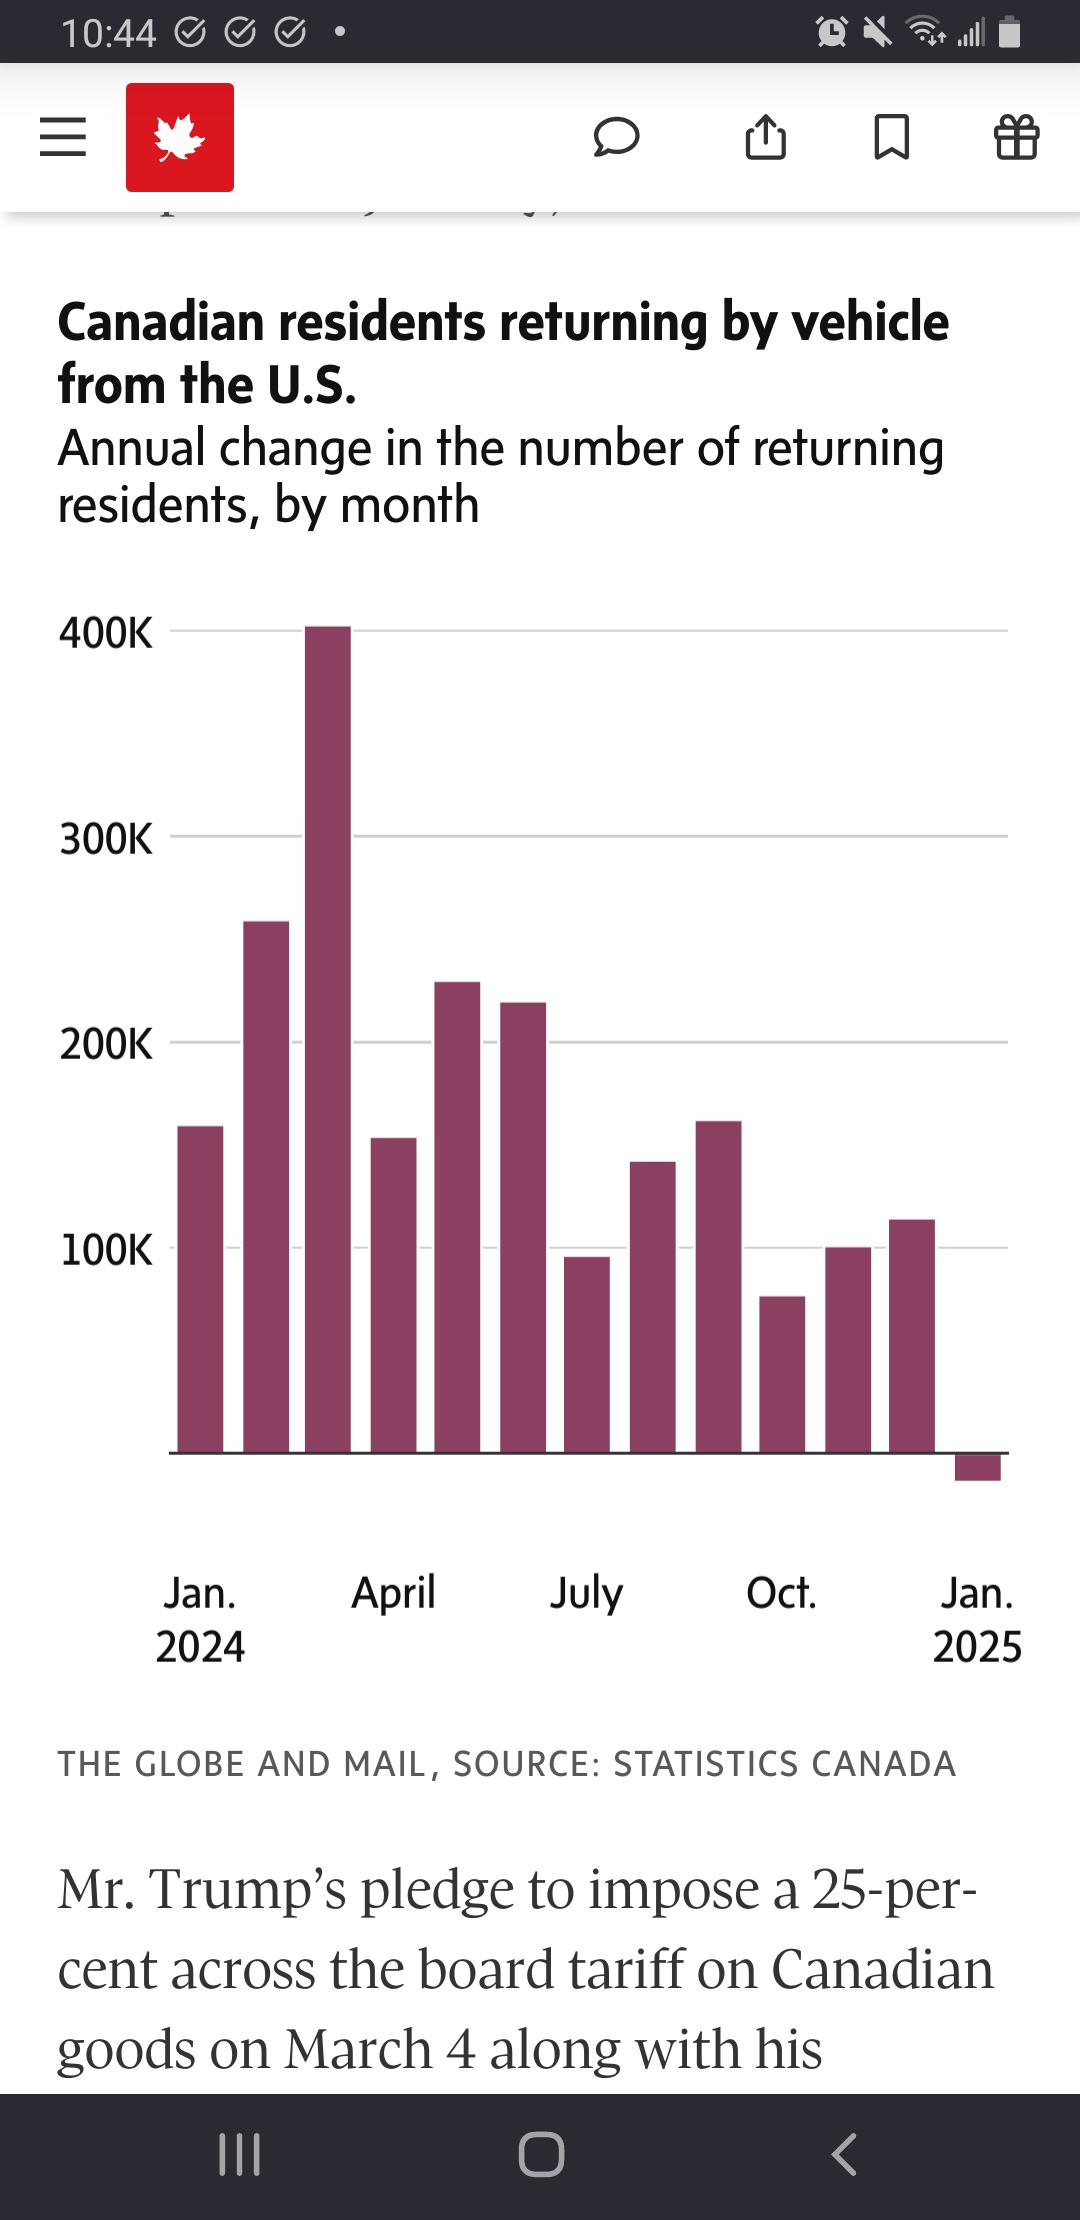
This graph is non-intuative.
So max is 400k returns, so do we assume that this shows 400k out/in trips in Feb 2024?
Jan 2025 shows what? -20k returns, so 20k people leaving Canada and not coming back?
Yeah, this isn't making much sense. What's also frustrating is that it's a screenshot from an article, which presumably could provide context to the chart.
Why isn't there a link to the original article itself? No source, nothing?