Located in London, I measured the RTT or round trip time to 574,691 random webservers and plotted the times on the globe.
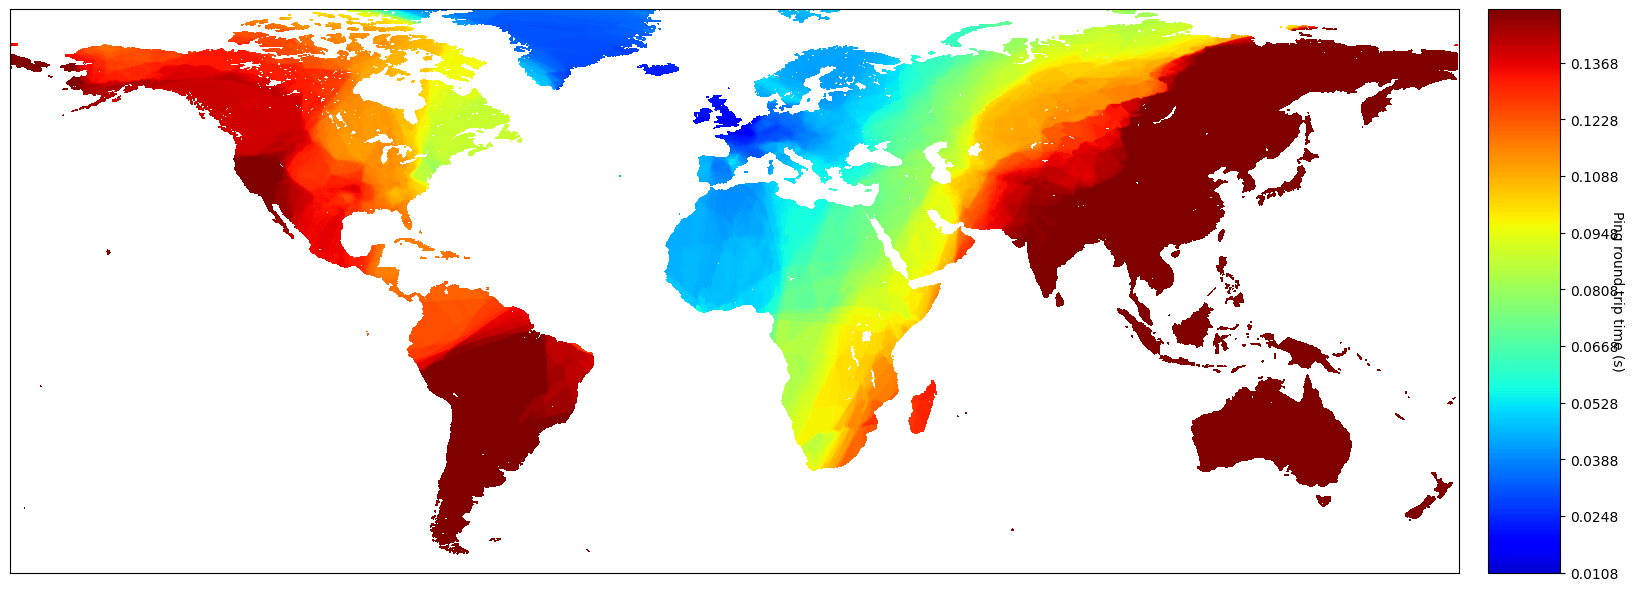
Discovery was done with masscan, measurements using hping and plotting with an old Python script I've revived and enhanced.
~~This is part of the next writeup on my blog, with which I will be posting any of the code I've used.~~
Could you calculate shortest distance to each point (using for example haversine formula) and then divide each time you got by 2*distance/c to get some sort of normalized score for connectivity? Anything closely approaching 1 would be the optimal connectivity to that destination.
Edit: c would be speed of light
In normal fiber optic cables the signal only travels at ~60% of speed of light. I dont think hollow core fibers are widely adopted yet for undersea cables, so the results should reflect that. Ofcourse you also have delays due to the relay stations in between, but those are probably quite small.
LEO satellite comms coming online to route some of this traffic should be closer to c since will relay satellite to satellite to the last mile ground station to then reach the destination.
It is faster per distance covered, but the distance that needs to be covered is significantly larger so it cancels out i think.