this post was submitted on 11 Feb 2024
0 points (NaN% liked)
Data Is Beautiful
6847 readers
1 users here now
A place to share and discuss data visualizations. #dataviz
(under new moderation as of 2024-01, please let me know if there are any changes you want to see!)
founded 3 years ago
MODERATORS
you are viewing a single comment's thread
view the rest of the comments
view the rest of the comments

Lol.
No it isnt.
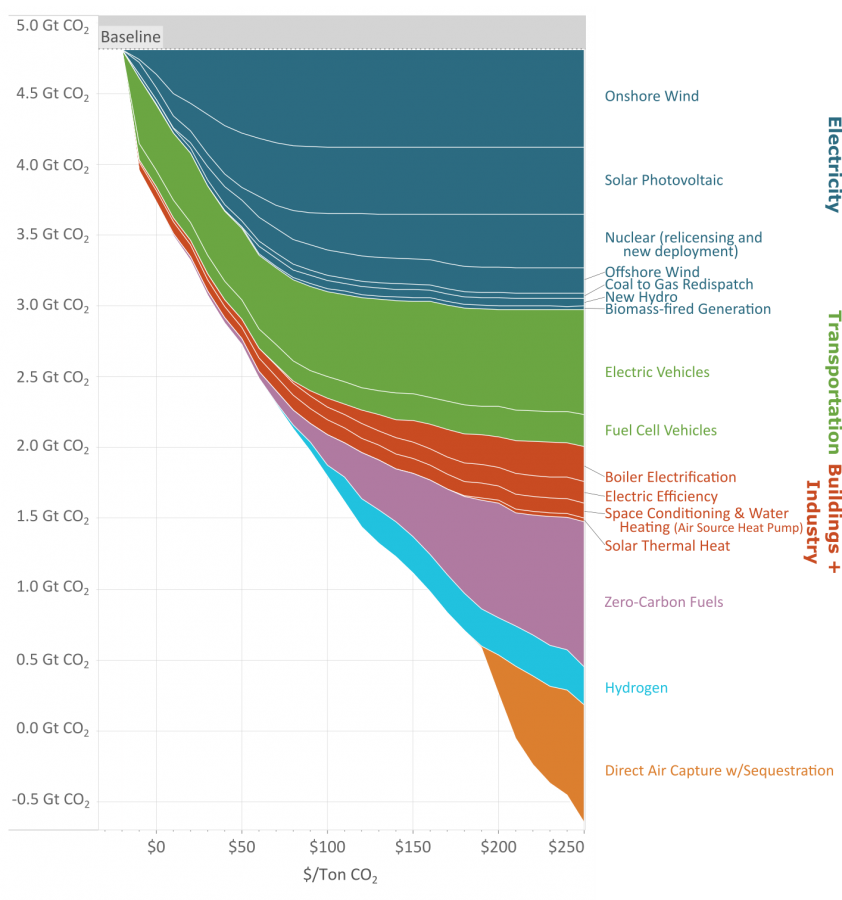
Average annual emissions are 10gt per year right now.
Y here is 'cumulative' carbon offset capacity (which is a bit of a misnomer because in their method you 'stop' doing things that are 'cheaper' at lower cost per unit carbon, which is like, not a good assumption to make, but we'll stick with it for just trudging through this disaster of a figure).
This is why data presentation matters. People who don't know what they are talking about or how to understand these things will make the wrong conclusions.
Hmm actually looks like this is only the US. Yeah that should have been more clear.